

Deep Dive Into Solar Financials with me (a Solar Business Owner)
When homeowners compare solar proposals, the payback period is often one of the first numbers they look at.
It feels simple: how many years until the system pays for itself?
But that number is only as trustworthy as the assumptions behind it. A small change in electricity usage, power rates, escalation rate, or shading can make the same solar system look much better or worse on paper.
In this post, I am using my own home as a real example so you can see how those inputs change the final numbers, and why it is so important to understand what is behind a solar proposal before making a decision.
My Home will be our Control
Introducing my home, which we will use as the control model. These are the baseline assumptions I used in the modelling:
- 4% electricity cost escalation rate
- Annual consumption of 5,500 kWh per year
- Pre-solar rate of 15 c/kWh (this number is not just the simple $/kWh from my bill, but includes the variable charges from the distribution and transmission fees on my bill that are also reduced by going solar)
- Post-solar rates: 7 c/kWh for the winter, 33.5 c/kWh for the summer
My results:
- 103% energy offset
- 5,691 kWh production in year 1
- Payback period of 8 years
- Lifetime savings (25 years) of $41,876.32
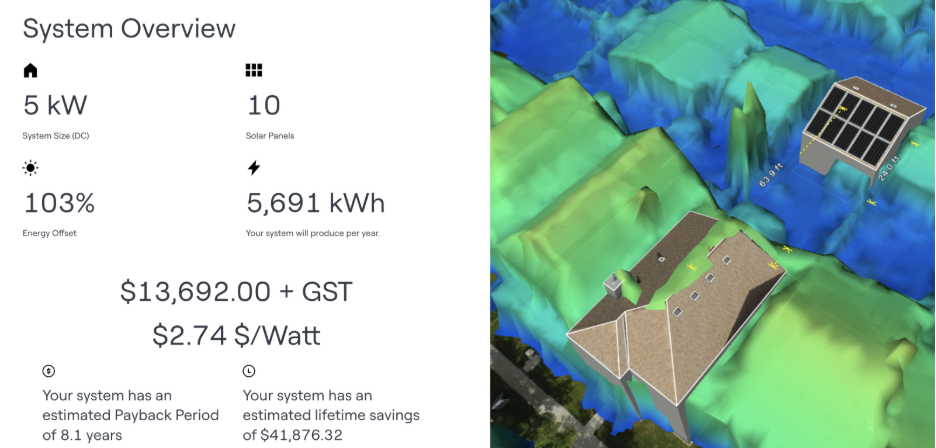
Now let’s change one assumption at a time and see how each change affects the proposal results.
1. Outdated Bills: What if your true electrical consumption is not inputted properly?
Assumptions:
- Annual consumption of 4,800 kWh per year
- 4% escalation rate
- Pre-solar rate of 15 c/kWh (this number is not just the simple $/kWh from my bill, but includes the variable charges from the distribution and transmission fees on my bill that are also reduced by going solar)
- Post-solar rates: 7 c/kWh for the winter, 33 c/kWh for the summer
My results:
- 114% energy offset
- 5,691 kWh production in year 1
- Payback period of 8 years
- Lifetime savings (25 years) of $42,298.12
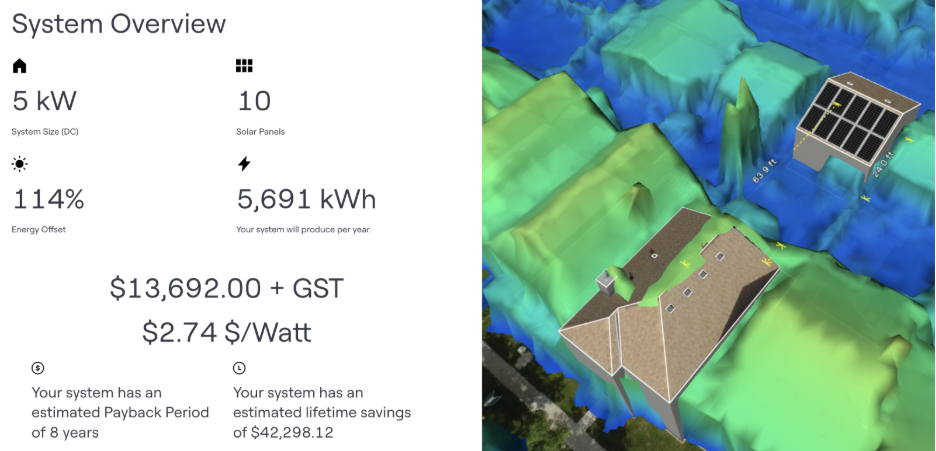
You might look at this and wonder – but that’s great! You have a higher offset and lifetime savings and a lower payback period! BUT Enmax/Fortis/EPCOR would not approve an application with 114% offset. So it would come back rejected, asking us to remove a panel.
Great – so we remove a solar panel, and submit the application assuming 4,800 kWh/yr consumption.
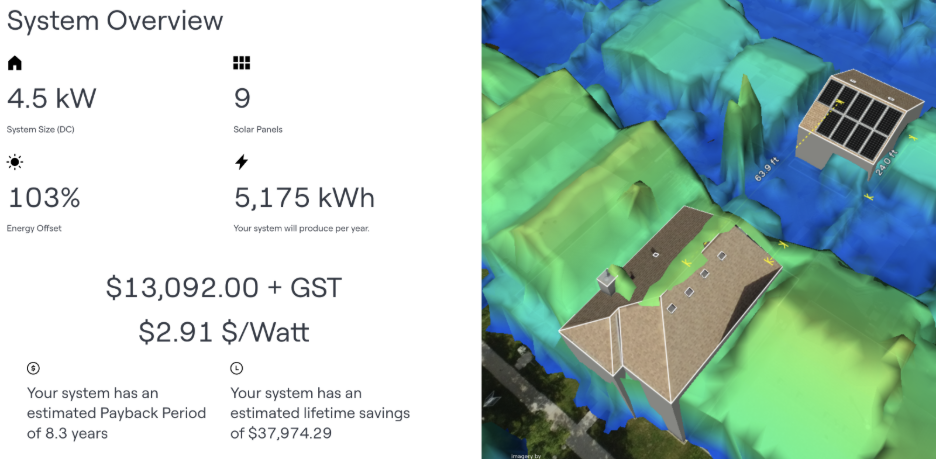
The new design with 9 solar panels now has very similar numbers compared to our "Control”. However, in reality, the consumption data is NOT 4,800 kWh/yr, but 5,500 kWh/yr. This means that none of the numbers highlighted in yellow are accurate.
If we use the correct consumption data and run the design with 9 solar panels, this is what this solar system would produce in real-life:
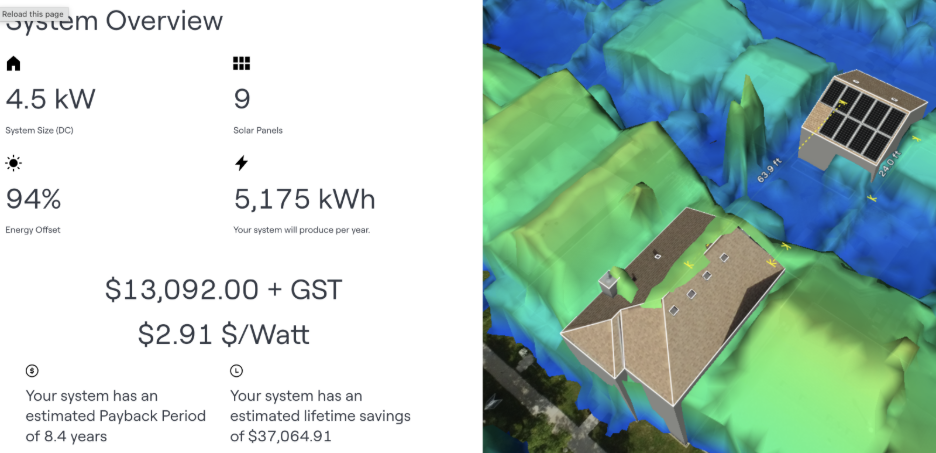
Having the correct consumption profile is critical for a solar design. If it’s wrong, your system might be undersized and won’t deliver the savings you were shown.
2. Higher Escalation Rate: What if the installer assumes electricity rates will increase at a higher rate?
Assumptions:
- Yearly consumption of 5,500 kWh per year
- 5.5% escalation rate
- Pre-solar rate of 15 c/kWh (this number is not just the simple $/kWh from my bill, but includes the variable charges from the distribution and transmission fees on my bill that are also reduced by going solar)
- Post-solar rates: 7 c/kWh for the winter, 33 c/kWh for the summer
My results:
- 103% energy offset
- 5,691 kWh production in year 1
- Payback period of 7.8 years
- Lifetime savings (25 years) of $52,650.68
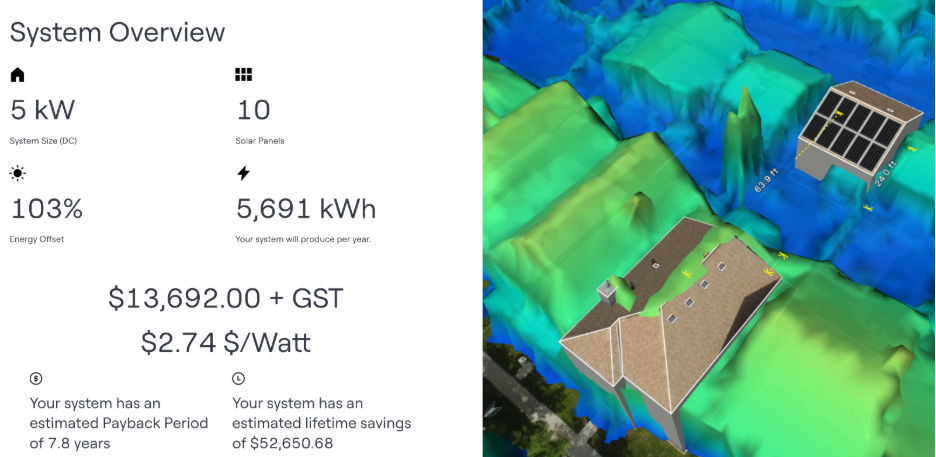
A higher escalation rate makes solar look better on paper because every future year of avoided electricity cost is assumed to be larger than the last, which increases the projected lifetime savings. At 5.5% per year, the assumption is that the current 15 c/kWh you pay in 2026 becomes about 57 c/kWh by 2051, which is almost 4x today’s rate.
3. Your Electricity Rate: What if the installer assumes you pay more for electricity than you do?
Assumptions:
- Yearly consumption of 5,100 kWh per year
- 4% escalation rate
- Pre-solar rate of 20 c/kWh
- Post-solar rates: 6 c/kWh for the winter, 35 c/kWh for the summer
My results:
- 103% energy offset
- 5,691 kWh production in year 1
- Payback period of 6.9 years
- Lifetime savings (25 years) of $53,328.95
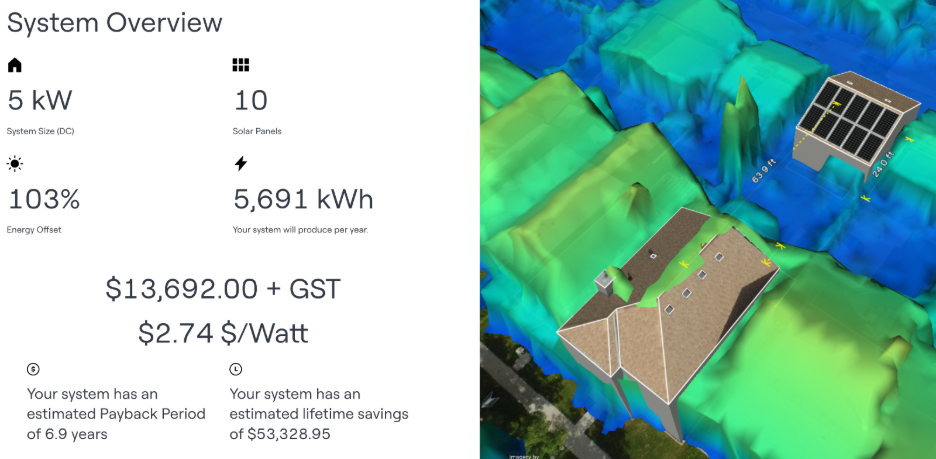
Similarly to increasing the escalation rate, a higher base electricity rate makes solar look better on paper, because it assumes you’re paying more for electricity today. Some solar installers might not use your base electricity rate when designing you a solar system, they often use Alberta’s average electricity rate, which may be higher than what you are currently paying.
4. Not Accounting for Shading: What if the installer assumes you have no shading from nearby trees or neighboring homes?
Assumptions:
- Yearly consumption of 5,100 kWh per year
- 4% escalation rate
- Pre-solar rate of 20 c/kWh
- Post-solar rates: 6 c/kWh for the winter, 35 c/kWh for the summer
- Not using any LIDAR shading on my design!
My results:
- 114% energy offset
- 6,283 kWh production in year 1
- Payback period of 7.7 years
- Lifetime savings (25 years) of $44,788.64
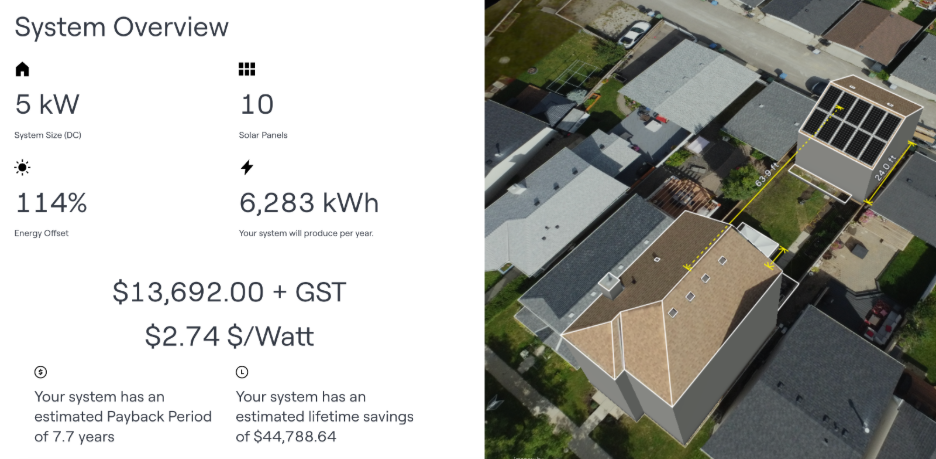
Without proper shade modelling using LIDAR data, along with manually added trees, vents, and nearby obstructions, the model assumes each solar panel receives full, unobstructed sun. That can make the production estimate look higher than what the system will produce in real life. And just like with incorrect consumption data, an inflated energy offset can cause the wires owner to request a smaller system, leaving the homeowner with a design that does not produce as much energy as they expected.
5. Side by side Comparison and Takeaways
Key takeaways:
- Electricity rate forecasts can significantly impact projected savings.
- Future usage assumptions can alter expected returns.
- System degradation and production estimates vary between proposals.
The question you're probably asking here is what makes our proposals and models better than anyone else’s?
- We validate our performance models against real-life data
- almost all of our solar designs are within 3% of real life
- we apply the same process consistently across our designs.
I hope I haven’t bored you to death so far... but if you’re feeling a little dread right now and wonder if you could ever trust a solar design and proposal, head over to our Can I Trust the Financials in a Solar Proposal? blog page for some reasurrance.
Final Thought: A Good Solar Proposal Should Stand Up to Questions 💪
The best solar proposal is not always the cheapest one, and it is not automatically the one with the flashiest solar panel brand, the shortest payback period, or the most confident sales pitch. A strong proposal should be clear, well-modelled, technically sound, and transparent enough that you can understand exactly what you are paying for.
I hope that you feel more prepared and empowered to tackle those solar proposal meetings. And remember, a solar contractor must be able explain their assumptions, equipment choices, financing structure, and design decisions. If they can’t, then move on and find someone who can. Solar is a long-term investment, not a one-page price comparison. The details behind the numbers matter.
If you are comparing solar quotes and want some help navigating the numbers, we would be happy to walk you through it!
If you want a broader look at the assumptions and sales tactics that can make solar proposals hard to compare, I also recommend reading 5 Secrets Solar Installers Don’t Want You to Know, where I break down several behind-the-scenes factors that affect pricing, payback, financing, and system value.